Reading Logger Data
 Timelapse data loggers, and all other loggers in our range, have removeable memory cubes installed inside them. These plastic cubes made in various colours enable you to take field data back to the office and read it indoors rather than lug a laptop or PDA around the countryside. You simply fit a fresh cube to carry on counting, and take the used one back to the office. The data written into a memory cube is non-volatile and it cannot be accidently erased. A Memory Cube Reader unit plugged into a serial or USB port enables any PC to read and display the recorded data.
Numero for Windows
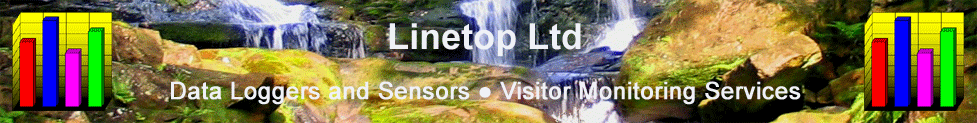
 The Numero program runs on Windows XP, 2000, ME and 98. It displays the results from one run of one logger on one site at a time. The data is viewed as a spreadsheet or a chart which can be panned and zoomed to see everything or just some selected details. Numero will open data from a memory cube, or a logger, or an existing file on the PC. It will display it as hourly or daily totals and when you are satisfied that the data is valid then you can transfer it into the EcoPC database for more analysis and to make between-sites and long-term comparisons. All charts and tables in both Numero and EcoPC can be cut and pasted into office documents - and web pages like this.
A chart showing daily totals. Note the normal weekends and bank holiday weekend peaks.
EcoPC Database
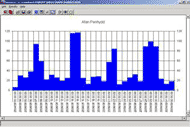
 EcoPC presents a fully ‘joined-up’ view of visitor data. You will likely visit your counter sites on arbitrary dates to set them up and later to collect the data, but you will want to see it presented on a weekly, monthly, or quarterly basis etc. You might want to compare one site with several others, or the same site in different seasons or different years. These number-crunching and presentation tasks are performed by the EcoPC database. EcoPC has three user views: an intelligent clickable colour-coded calendar showing daily totals and other statistics, plus charts and tables which show the answers to specific database queries. It is very simple to use yet produces impressive results.
Site list, year list and calendar view of the site and year selected .
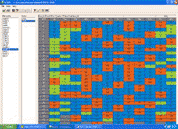
The charts below show the original hourly totals recorded at three sites combined in EcoPC to produce different views. Monthly totals 2004 top left; 2004 totals by weekday, top middle; 2004 by hour-of-day profile, top right; Monthly totals 2004 stacked, bottom left; 2004 totals as a piechart, bottom middle; 2003-2005 by quarter, bottom right. Producing charts like these takes just a few clicks.
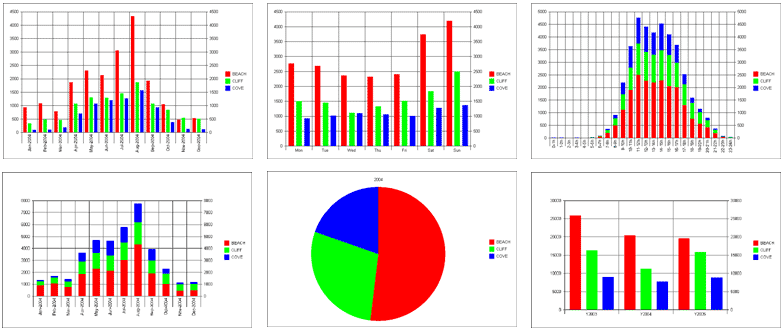
Data which is available as a chart is also available as a numeric table which can be pasted into Excel to add further calculations and presentational effects:
BEACH
|
CLIFF
|
COVE
|
|
2003
|
25886
|
16319
|
8984
|
2004
|
20466
|
11217
|
7748
|
2005
|
19606
|
15846
|
8848
|
AVG
|
21986
|
14461
|
8527
|